

Abstract: We review some widely held misconceptions regarding our national debt in the United States, which currently stands at about $37 trillion. A short historical overview of national debt follows, with an emphasis on the ups and downs of debt growth. A key issue in the paper is the fact that the United States has reduced tax revenue yield after 1980. Moreover, we emphasize the enormous impact of the Great Recession and the even greater impact of the Covid-19 Pandemic on the spectacular and rapid rise in our national debt in this century. The paper concludes with a set of observations based on what has worked before in the United States as well as what seems to have helped other nations seeking to control their annual budget deficits, as well as their respective national debt.[1]
The size of the national debt in the United States makes it an irresistible target for sensationalism. At roughly $37 trillion and counting, it’s a figure so colossal that commentators often reach for theatrical metaphors to convey it – piles of cash reaching various celestial bodies and back, many multiples of the national debt of other nations, intergenerational robbery, and on and on.
Part of the nonsense about the national debt involves framing the issue as though the entire national debt will come due on a singular, dark day, crushing whichever generation is unlucky enough to be around when the music stops, a generation abandoned by its predecessors, left to pay well over three dozen trillions of dollars in one lump sum. In reality, a sovereign government’s debt is not settled in a single dramatic moment. It is continually rolled over and refinanced, with different tranches of debt coming due at different times and at different interest rates. Repayment proceeds across decades, not on any given day. To be sure, none of this is to suggest that national debt is a free lunch or that public debt can grow without negative consequences or that it isn’t at this moment a very serious problem.
Then there is the debt dirge, intoning ominous warnings that a catastrophe is always just around the corner. Hyperinflation, a plunging dollar, foreign creditors holding America hostage — over the years we’ve heard it all, repeatedly and emphatically. Yet the promised economy-destroying financial apocalypse has, as of yet, not shown up. To be sure, none of this is to suggest that national debt is a free lunch or that public debt can grow without negative consequences or that it isn’t at this moment a very serious problem.
Also true is the fact that the United States, despite its rising debt, has so far avoided debt oblivion. In fact, there is no reason why the United States ever needs to pay back its entire debt (Wolla and Frerking, 2019). Still, if you’re paying attention, there is no doubt that the fiscal landscape is scary. Consider that half of all federal spending since the beginning of the Republic has occurred in the past 25 years (Brady, 2022). Our national debt in the year 2000 was about $5.6 trillion and has, as of today, increased by 560% to $37 trillion. That’s a wild ride by any definition. Anxiety about the national debt is certainly reasonable (Gale, 2019).
A very large national debt is manageable, however, if interest rates stay low or can be reduced and investors remain confident. Our running national tab, on the other hand, can become severe much sooner if borrowing costs spike and remain high for a long time. Put simply, the real question is not “How big is the debt?” but rather “Under what conditions does the liability become problematic and what ought we to be doing about the problem then?”
A Short Overview of U.S. National Debt
Early 19th Century. The following figure illustrates the percentage of debt held by the public as a percent of GDP, the so-called debt-to-GDP ratio between 1795 to the present, with some projections out to 2055.
In the early 19th century, the young United States took on debt primarily to finance wars. The War of 1812, for example, was mostly funded by borrowing, more than doubling the national debt – from roughly $45 million in 1812 to about $119 million by 1815, a hefty increase for such a short period.
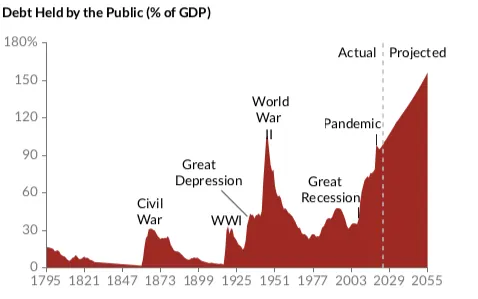
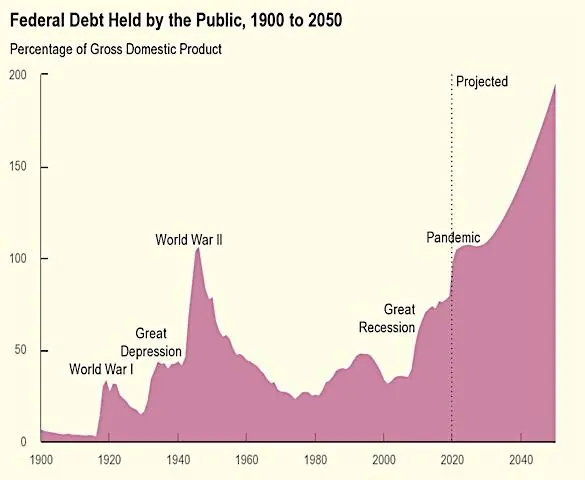
Source: For both previous tables: Congressional Budget Office; Peterson G. Peterson Foundation.
Peacetime growth allowed the government to pay down much of its debt. In fact, President Andrew Jackson managed to pay off the U.S. national debt completely by 1835 – the only time in history that the country has been debt-free, albeit only for two years. Jackson accomplished this in part through an aggressive policy of selling off federal lands and insisting on payment in gold and silver. However, Jackson’s policies also contributed to the Panic of 1837, resulting in the return of deficits and national debt (Temin, 1969).
The costs of the Mexican–American War (1846–48) accelerated federal borrowing again, with public debt about $16 million at the beginning of the war and reaching about $63 million by 1849, nearly 300% in three years. Still, by the mid-19th century, U.S. debt remained modest as a share of the growing economy.
The Civil War and Its Aftermath. The Civil War (1861–1865) was a gargantuan financial shock, never mind its other immense socio-political implications (Ransom, 1998). In 1860, on the eve of war, total federal debt stood at only $65 million, about the size of one year’s federal budget at the time and just a small fraction of GDP. Financing a massive war effort caused unprecedented borrowing and inspired new ways of financing government, including the nation’s first experience with a federal income tax. The national debt surpassed $1 billion for the first time in our history by 1863 and reached $2.7 billion at war’s end in 1865. The more than 40-fold increase in the national debt over the course of the war was unimaginable beforehand.
After the Civil War, the U.S. entered a long period of debt repayment and fiscal caution. The federal government retained the Civil War income tax until 1872, which helped pay down the war-generated debt. Interestingly the income tax wasn’t decisively litigated until the U.S. Supreme Court in Pollock v. Farmer’s Loan and Trust Co. (1895) struck down the tax in a 5-4 decision.
The federal government ran frequent, substantial budget surpluses – 36 surpluses for the next 47 years after the Civil War – and managed to pay off about half of the Civil War debt by the turn of the 20th century. The GOP, after the War, also enacted high tariff rates that persisted through the 19th century, bringing in substantial revenue. Equally important, the Civil War boosted Union-states’ industrialization and large-scale work-force improvements and scientific advances, all of which accelerated after the Civil War (Khan, 2016). Immigration to the United States also began to quicken at unprecedented rates and steeper federal excise taxes on many products, particularly on alcohol and tobacco, augmented federal revenues throughout the rest of the 19th century.
By 1899 a growing GDP, increased population, and new forms of taxes pushed down the gross federal debt to roughly $1.9 billion. The 19th century confirmed a pattern: wartime borrowing would swell the debt, but peacetime growth and disciplined budgets would bring it back down. By 1914, the national debt was about 3% of GDP, a decline of over 90% from its Civil War high.
Early 20th Century: World War I and the Great Depression. The next major debt spike came with World War I. The U.S. funded its late entry into WWI largely through Liberty Bond drives. Total federal debt climbed to about $25.5 billion by 1919. However, the 1920s saw a return to budget surplus for eleven consecutive years as the government tightened its belt. Federal spending declined from $6.3 billion in 1920 down to $3.3 billion by 1922 and taxes were kept relatively low. These surpluses allowed the U.S. to pay down debt by roughly one-third during the 1920s. By 1929, on the eve of the Great Depression, the nation’s debt had been reduced to about $16–17 billion – a decline in both absolute terms and as a share of GDP.
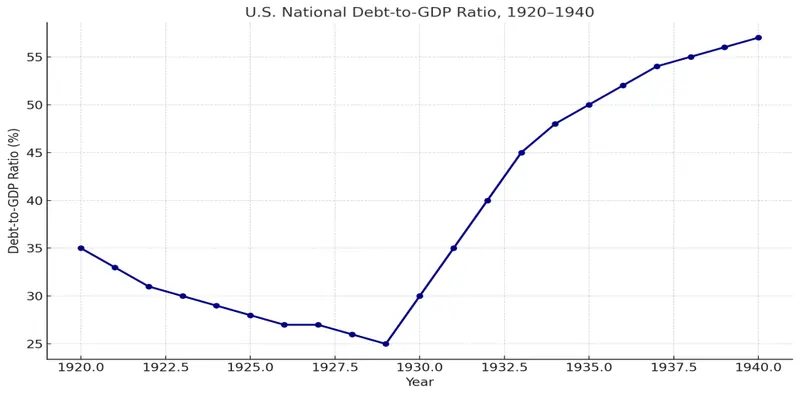
The Great Depression suddenly and dramatically reversed that trajectory. Government revenues plunged as the economy contracted by nearly a third between 1929-1932, and federal spending rose in an effort to combat the crisis through public works and relief programs. President Herbert Hoover initially tried to balance the federal budget, even raising taxes in 1932, but the deepening hardship among Americans made growing deficits unavoidable. Insofar as government spending was required to pull the nation out of economic depression, no one at the time comprehended how much greater the spending needed to be. World War II, which is when the U.S. economy finally emerged from depression conditions, illustrated the magnitude of the required infusion of money and credit (Lawson, 2006).
The following figure illustrates the dramatic rise of national debt during the Great Depression, resulting largely due to declining revenue, although later efforts to spend the nation out of the economic pit were largely anemic but did add to the national debt’s steep growth. The Great Depression remains the most severe economic decline in American history. Not repeating that experience is a major achievement in American macroeconomic policy making, if not the broader post-World War II economic order (Crafts and Fearon, 2010).
World War II and the Post-War Boom. With U.S. entry into World War II, public debt exploded from about $51 billion in 1940 to $260 billion (over 409%) by 1945 as America financed its global military mobilization. At the war’s end, federal debt equaled roughly 112% of GDP (public debt), or about 119% of GDP if internal government borrowing is included. U.S. national debt was, for the first time, larger than the annual GDP, a record that would stand for decades, well, until now.
Yet this wartime debt was not controversial and was viewed as a necessary burden to achieve victory. Immediately after WWII, the U.S. benefited from a unique combination of factors that helped to reduce sharply the debt-to-GDP ratio. The United States was then the planet’s lone economic colossus and its post WWII growth was steep and largely sustained, with the occasional brief slow-down. And unlike previous conflicts, the Korean War (1950–53) was largely financed by current taxation and did not add much to the debt burden as the U.S. economy at the time grew even more rapidly than did the annual deficit.
From its WWII peak the debt ratio fell dramatically, from about 90% of GDP in 1950. By 1974, the federal debt hit a postwar low of only 25% of GDP – a striking turnaround. In nominal terms, debt remained roughly flat in the 1950s–60s, while GDP grew rapidly. The trends are illustrated in the following Figure 4.
Even substantial spending programs like the Interstate Highway System and Great Society social programs or the Vietnam War, did not produce increases in the debt-to-GDP ratio, because the overall economy was expanding faster.
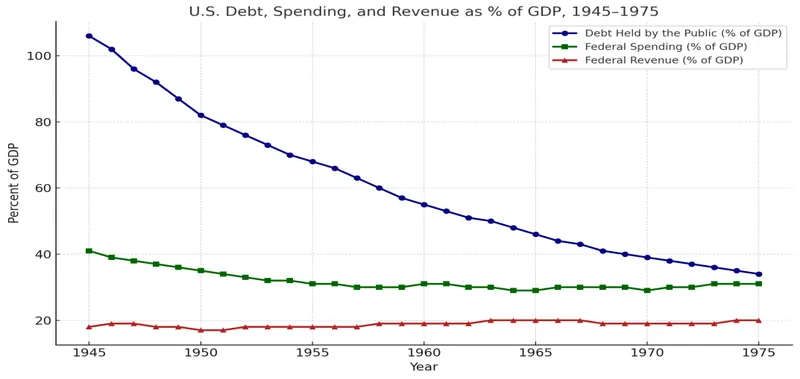
By the mid-1970s, however, this largely benign trend came to an end, punctuated by the 1973 oil crisis. Economic and employment growth slowed, even declined, while inflation spiked (stagflation). Our Vietnam failures, on-going strife over Civil Rights, Watergate and the recriminatory politics that these events infected politics and policy making with widespread, worsening public frustration with the operation of government at all levels (Mitchell and Scott, 1987; McGrath, 2017; Schudson, 2004).
A dramatic expression of the public’s disaffection was the so-called tax revolt (Martin, 2008). Among conservative politicians, intellectuals and scholars there arose a popular movement around the theme that “too much government” was a drag on the performance of the economy and that government size had become a source of growing fiscal mismanagement. Cut public revenue and you then, at some point, force cuts in spending and, thereby, force greater balance and prudence in budgets as well as slow public sector growth and reduce the scale of government (Bartlett, 2007).
The federal budget process also changed in ways that over the long haul made deficits more frequent, larger, and more difficult to manage. The Congressional Budget and Impoundment Control Act of 1974, for example, perhaps justifiably, shifted more budgetary power back to Congress (Congressional Research Service, 2025). Prior to Richard Nixon, presidents from Thomas Jefferson to Lyndon Johnson would sometimes impound federal funds authorized by Congress. Their reason for doing so almost always had to do with managing very specific fiscal circumstances. For example, Thomas Jefferson delayed spending for gunboats when in 1803 tensions with France eased or Franklin Roosevelt and Harry Truman impounded funds no longer needed for military purposes.
Those earlier impoundments were not generally directed at frustrating or altering Congressional policy priorities. Richard Nixon, however, began to deploy impoundment primarily as a way to battle his political opponents and to undermine Congressional policy choices, as when he impounded EPA founds as well as outlays for a host of other programs that Congress authorized over his veto. Nixon did this as a weapon of opposition to programs he opposed on political or philosophical grounds. Congress reaffirmed its constitutionally grounded grip on fiscal matters via enacting limits on presidential impoundment.
Unfortunately, both Democratic and Republican members of Congress regularly found it difficult to cut spending in timely or significant ways when constituencies or powerful interests resisted reductions, never mind elimination, of programs. It turns out that in many ways achieving Congressional spending restraint is a typical collective action problem, where each individual member of Congress figures that everyone else can be fiscally responsible, while he or she plays the role of sugar daddy or sugar mama for their constituents. As elections loom almost immediately after the previous election, each House member is fundamentally concerned with only one out of 435 districts in the nation’s lower house and from which presumably all money bills originate.[2]
With elected officials unwilling to inflict pain on constituents, yet happy to bring home expensive goodies for the folks at home, it became increasingly clear that Congress was mostly reluctant to take high profile hits for cutting popular or strongly supported programs, even when general fiscal restraint might be required or advised. It’s one of the reasons we currently rely so heavily on the still independent Federal Reserve’s monetary manipulations for predictable, well-considered macroeconomic policies, especially when fiscal restraint is called for, as in the case of general inflationary settings.[3]
After reaching a low point of nearly 25% of GDP in the 1970s, the debt-to-GDP ratio began creeping up again. By 1980 federal debt stood at roughly 26% of GDP (public debt) or about 30% of GDP in gross terms. This was still low by historical standards, but the era of mostly shrinking debt relative to GDP, was about to end.
The 1980 Watershed and Beyond. The 1980s marked a dramatic and qualitative change, as large and growing peacetime deficits re-emerged and the debt-to-GDP ratio, with only brief intermissions, grew rapidly. What launched this structural change were a series of tax cuts and immense defense spending increases under President Ronald Reagan. The Economic Recovery Tax Act of 1981, wrapped in the theoretical chic provided by Arthur Laffer’s Magical Supply-Side-Curve, slashed income tax rates in an effort to stimulate growth. At the same time, Cold War defense spending ramped up sharply. Moreover, the automatic increases in revenue that previously resulted from bracket creep no longer existed after 1980, due to indexing of the tax code and the compression of tax brackets into a smaller number with much lower marginal rates.
Simultaneously, Congress, initially led by Democrats during most of the 1980s decade, had no appetite for enacting deep program cuts or raising broad-based taxes. Having galloped out of California, the tax revolt was now nationally ascendant (Graetz, 2024). The result was that revenues dropped, expenditures rose, and deficits exploded, particularly since the Reagan tax cuts did not, as promised, “pay for themselves.” The Reagan tax cuts stimulated some additional economic activity, but not nearly enough to offset the revenue loss. Analysts estimated that the positive growth effects of the 1981 tax cuts ultimately recovered only about one-third of the lost revenue (Steele, 2022; Modigliani and Modigliani, 1987; Steele, 2022).
From about 26% in 1980, national debt darted to about 41% by 1988. In absolute dollars, the gross national debt during the 1980s rose from around $908 billion in 1980 to about $3.2 trillion in 1990, a rise of over 250%.
Recognizing the emerging deficits and their negative political effects, the Reagan Administration supported the enactment of several modifications to the initial tax cuts, effectively raising taxes. The Tax Equity and Fiscal Responsibility Act of 1982 was the most significant, closing loopholes and increasing corporate and excise taxes – it was, when adjusted for inflation, one of the largest peacetime tax increases in U.S. history, even if the tax increase was camouflaged and sugar-coated as “reform.”
Additional deficit-reduction measures in 1984 and bipartisan Social Security reform in 1983 raised payroll taxes and partially pared back the earlier tax reductions. President Reagan, agreed to these “revenue enhancements” as the debt trajectory worsened and public disquiet and elite clamor about the size of the debt increased (Committee for a Responsible Federal Budget, 2017).
Facing genuine, election-relevant public concern about mounting red ink, policymakers also experimented with new fiscal rules to discipline the debt. In 1985, for example, Congress passed the Gramm–Rudman–Hollings Act, the first binding constraint on federal spending growth. This law set declining annual deficit targets and threatened automatic, across-the-board spending cuts, known as “sequestration,” if Congress failed to meet those targets. The idea was to force lawmakers to either find savings or face painful cuts imposed by formula. In practice, Gramm–Rudman only had mixed success. Initially, the mere threat of sequesters pressured Congress into some spending restraint, but the targets proved too optimistic. Congress just ignored them as constituent pressures intensified in opposition to further cuts.
When deficits didn’t fall as fast as mandated Congress simply revised the law to loosen the goals. A 1986 Supreme Court ruling, Bowser v. Synar, 478 U.S. (1986), also found part of the mechanism unconstitutional, weakening its enforcement. By the late 1980s, it was clear that Gramm– Rudman had failed to prevent large deficits. The debt continued to climb into the early 1990s, and Washington was obliged to embrace a new approach.
The early 1990s briefly restored fiscal discipline. In 1990, President George H. W. Bush agreed to the Budget Enforcement Act. The result was an increase in the marginal income tax rates, higher excise taxes, a bump in the payroll tax, and the enactment of some new fees designed to mitigate environmental problems. The new law also replaced fixed deficit targets with two hard tools: caps on discretionary spending and a pay-as-you-go requirement for any new entitlement spending or tax cuts, enforced by automatic sequestration.
President Bill Clinton’s 1993 package further raised the top tax rates and also restrained spending, and the 1996 welfare reform law added time limits on welfare benefits and imposed work requirements. Notwithstanding the merits or criticism of the welfare reform, it is worth noting that President Clinton also accepted considerable risk and criticism from the left of his party for agreeing to the welfare reforms. Combined with post–Cold War defense cuts and a strong expansion fueled by low interest rates and the Dot-Com investment festival, the United States moved into budget surpluses from 1998 through 2001.
Tax increases in 1990 and 1993, a smaller deficit-reduction package in 1997 and the enforcement rules to which Congress adhered kept deficits in check. Debt as a share of gross domestic product fell from about fifty percent in 1993 to about thirty-five percent by 2000. Gross federal debt declined from roughly sixty-six percent of gross domestic product in the mid-1990s to around fifty-five percent by 2000.
Unfortunately, success eased pressure to keep the constraints. That’s a refrain in this debt-crisis business. Progress is made. Complacency sets in. Guardrails and norms are jettisoned. Consistent with the cycle, Congress relaxed limits in the late 1990s, and without active support to renew them from the Bush II Administration, the Budget Enforcement Act expired in 2002.
Tax cuts in 2001 and 2003 lowered income tax rates yet again, along with reducing capital gains taxes, and dividend taxes with no offsetting measures, despite the fact that the 2001 recession had already significantly reduced revenue. Two wars in Afghanistan and Iraq also lifted defense spending to post–World War II highs. It was the period when then Vice President Cheney declared, “Reagan proved that deficits don’t matter.”
Then, in 2003, as a pre-2004 election gift to Medicare enrollees, the Bush II Administration pushed through Medicare’s new prescription drug benefit. The Medicare enhancement added an immense, unfunded obligation that cost about $46 billion dollars in its first year and roughly $146 billion dollars eighteen years later, for about $1.6 trillion cumulatively through 2024.
With pay-as-you-go rules gone, annual budget deficits returned. National debt held by the public roughly doubled in dollars from about $3.3 trillion in 2001 to about $6.4 trillion by 2008, and the national debt’s share of the economy rose as well; gross federal debt climbed from roughly 55% of gross domestic product in 2001 to about 68% by 2008.
The 2008 financial collapse deeply cratered revenue sources and simultaneously forced extraordinary government outlays in order to avoid a near-certain slide into a deep depression. The Troubled Asset Relief Program authorized $700 billion dollars and disbursed just under $450 billion to stabilize banks and the auto industry, while the Federal Reserve’s emergency backstops, many unprecedented and innovative, underscored the scale of the crisis (Financial Crisis Inquiry Commission 2011).
In 2009, under President Obama, the American Recovery and Reinvestment Act injected into the economy another $800 billion dollars in infrastructure spending, aid to states, unemployment insurance, and tax relief. These all likely contributed to keeping the Great Recession from becoming a second Great Depression
The annual budget deficit reached about $1.4 trillion in 2009 — roughly ten percent of GDP — and gross federal debt neared 100% percent of gross domestic product by 2012. Smaller programs added up as well: extended unemployment insurance to ninety-nine weeks, the “Cash for Clunkers” initiative, hundreds of bank resolutions by the Federal Deposit Insurance Corporation, and more than $180 billion dollars in Treasury support for Fannie Mae and Freddie Mac.
As the economy stabilized and concern for our burgeoning debt combined with policy makers’ concern for economic growth, a partial correction followed. The Budget Control Act of 2011 re-imposed caps on discretionary spending and created a sequestration that took effect in 2013 when a bipartisan Congressional committee failed to agree spending reductions. At the same time, tax rates on higher-income households rose in 2013 as parts of the earlier tax cuts expired. Federal budget deficits fell to about two and a half percent of gross domestic product—under five hundred billion dollars—by 2015, and debt compared with the size of the economy stabilized for several years. The level of debt, however, remained atop a higher plateau.
As unprecedented and disruptive the Great Recession was, The Covid-19 Pandemic was even more catastrophic on a broader economic, fiscal, and socio-political front. In 2020 and 2021, the Congress enacted the Coronavirus Aid, Relief, and Economic Security Act and follow-on laws totaling about $2.8 trillion dollars, and the American Rescue Plan added roughly $1.9 trillion more spending. These included direct payments to households, expanded unemployment insurance, the Paycheck Protection Program for small businesses, health and vaccine spending, and aid to state and local governments. Simultaneously, revenues fell dramatically and the collection of many taxes was deferred.
The 2020 annual federal budget deficit reached about $3.1 trillion, the largest single-year budget deficit in American history. Another multi-trillion-dollar gap of $2.8 trillion followed in 2021. Gross federal debt jumped from about $23 trillion dollars in 2019 to more than $30 trillion within two years, and debt relative to GDP rose above 120% and stood around 124% in 2024. As interest rates rose in 2022 and 2023 to fight inflation, annual net interest costs on our national debt climbed to about nine hundred billion dollars in 2024—roughly the size of the defense budget and not far from the cost of Social Security—creating the risk that interest on the national debt might itself might become a major driver of future budget deficits
The long-run pattern is clear. Wars and crises – societal and natural – ratchet debt up. Only extended peace, growth, and political will to run surpluses or to reduce significantly the annual budget deficit can curtail problematic growth in the national debt. Since the late twentieth century, those upward, debt growing patterns have stuck: the deficits of the 1980s, the financial crisis of 2008, and the pandemic of 2020 each left the United States on a higher debt ledge rather than returning to prior levels.
Today, by historical standards, we have a very high national debt compared with the size of our economy. We have a rising tide of beneficiaries receiving income security payments; we have interest rate uncertainty; and, even with already dangerous levels of political polarization, political acrimony continues to find ways to worsen. The costs of delay in launching sensible, sustainable management of our national debt are compounding. Sensible management, however, requires fair management. Yet, arriving at some consensus about what is meant by fair or just national debt management is also a very challenging policy puzzle.
A Key Issue: Our Revenue Deficiency
The fiscal system of United States generates less revenue than do other nations with which we like to compare ourselves. This is the case, despite the fact that we also spend less relative to most other peer nations. We spend less, and we collect even less revenue to support our relatively lower levels of public expenditures.
Very important but less often discussed, prior to 1980 federal revenues were consistently augmented, not only by the higher marginal tax rates that existed throughout the 1945-1980 period, but also by the increased revenue stream that “bracket creep” produced during the period (Research Department, Federal Reserve Bank of San Francisco, 1982).[4]
The following graph illustrates this critical point. From 1945 through the early 1970s spending and revenue tracked fairly closely. Spending outpaced revenues by relatively small margins, very occasionally and briefly revenues exceeded expenditures. The increased annual gap between spending and revenues widened somewhat in the early 1970s with the onset of stagflation after the 1973 oil embargo, initiated after the Arab-Israeli War that year. Something more fundamental and long-term happened after 1980, however, where regardless of the economy’s performance, budget deficits grew larger, more rapidly.
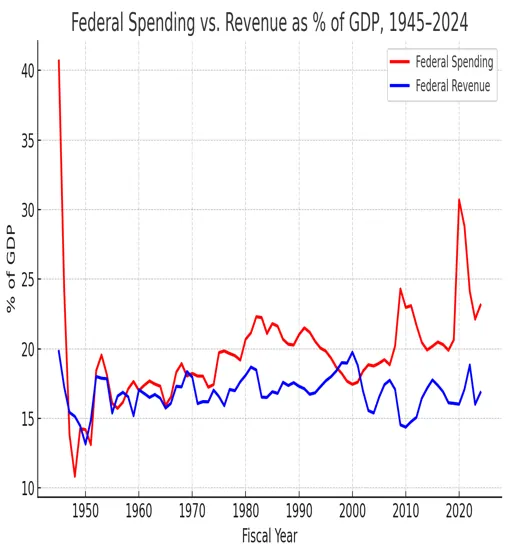
In the decades before 1980, federal tax revenues tended, on average, to rise more than proportionally with economic output – each 1% increase in GDP often generated an even larger percentage increase in revenues. Since 1981, however, the revenue “yield” of GDP growth has, on average, significantly diminished. This is illustrated in the following figure.
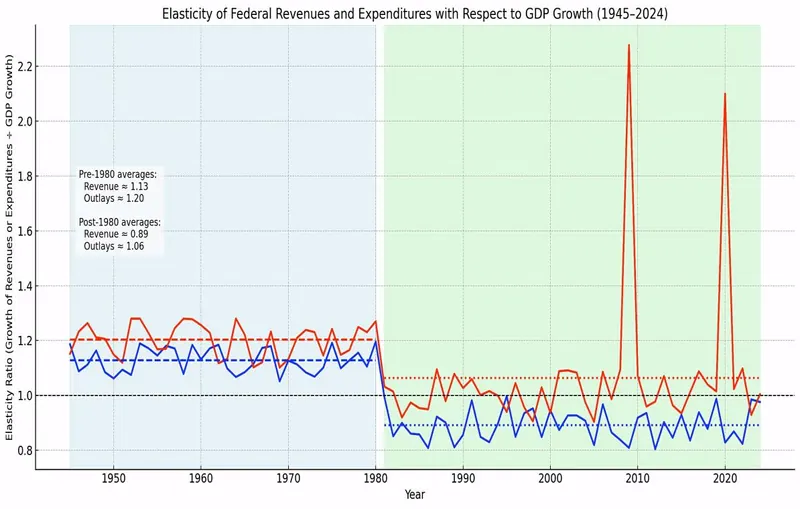
Red line = Expenditures
Blue line = Revenues
The black dashed line at 1.0 marks the point where revenues or outlays grow in exact proportion to GDP. In the pre-1980 era (blue shaded), both revenues and outlays were mostly above 1, meaning they grew faster than GDP. Revenues in particular were boosted by bracket creep, high rates, and payroll tax expansions.
In the post-1980 era (green shaded), revenue elasticity mostly dipped below 1.0. Revenues have consistently grown more slowly than GDP, reflecting tax cuts, rate reductions, increased cost of tax expenditures, and bracket indexation. Expenditures tracked closer to GDP but show sharp spikes well above GDP growth occurred during crises (especially in 2009 and 2020).
From the postwar 1940s through 1980, federal receipts grew robustly in tandem with a rapidly expanding economy – and often outpaced GDP growth. Between 1950 and 1980, nominal GDP increased roughly tenfold, whereas federal tax revenues rose about thirteen-fold. Revenues grew about 1.1% for each 1% increase in GDP. Key factors included bracket creep, high marginal tax rates, fewer loopholes, and expanding payroll taxes.
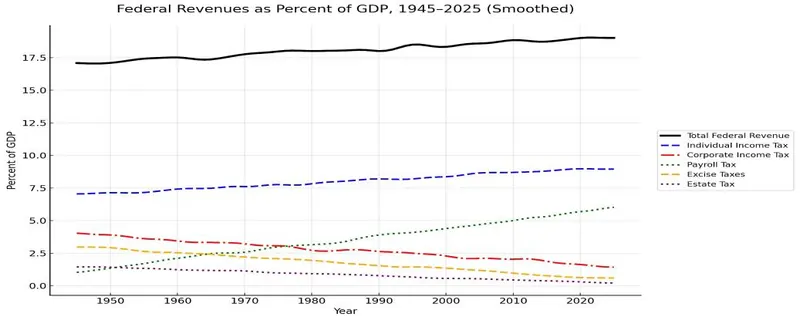
After 1980, the linkage between GDP growth and revenue growth weakened. Tax receipts grew more slowly than GDP, translating into less than a 1% increase in revenues for each 1% GDP rise. Major drivers of this trend included the 1981 Reagan tax cuts, bracket indexation, the 1986 Tax Reform Act, the Bush tax cuts of the 2000s, and the 2017 Tax Cuts and Jobs Act. Corporate and individual income tax elasticity relative to GDP declined, while payroll taxes stabilized around 6% of GDP.
Federal outlays expanded dramatically between 1950 and 1980, rising from about 15% to 21% of GDP. Defense buildups, Medicare and Medicaid, Social Security expansions, and countercyclical spending during recessions fueled U.S. spending growth.
After 1980, federal spending growth relative to GDP moderated. Expenditures hovered around 20% of GDP, with spikes occurring during crises (2008–09 Great Recession and 2020 pandemic). New and large defense increases launched during the Reagan Administration, entitlement growth, and fiscal stimulus drove temporary spending surges, but overall outlays no longer showed a secular upward trend with growing GDP. In fact the biggest increases in federal outlays now happen with economic downturns, when GDP stalls or even declines.
The trends discussed above are illustrated in the following tables and Figure 8 below.
Table 1. Overall Elasticity (Revenues and Outlays)
| Category | Pre-1980 Average Elasticity | Post-1980 Average Elasticity | Percent Decline in Elasticity |
|---|---|---|---|
| Total Revenues | 1.14 | 0.91 | -21% |
| Total Outlays | 1.22 | 1.02 | -16% |
Table 2. Source-by-Source Average Elasticity
| Revenue Source | Pre-1980 Average Elasticity | Post-1980 Average Elasticity | Percent Decline in Elasticity |
|---|---|---|---|
| Individual Income Tax | 1.20 | 0.92 | -23% |
| Corporate Income Tax | 1.31 | 0.72 | -45% |
| Payroll Taxes | 1.19 | 1.00 | -08% |
| Excise Taxes | 1.05 | 0.54 | -49% |
| Estate & Gift Taxes | 1.14 | 0.67 | -41% |
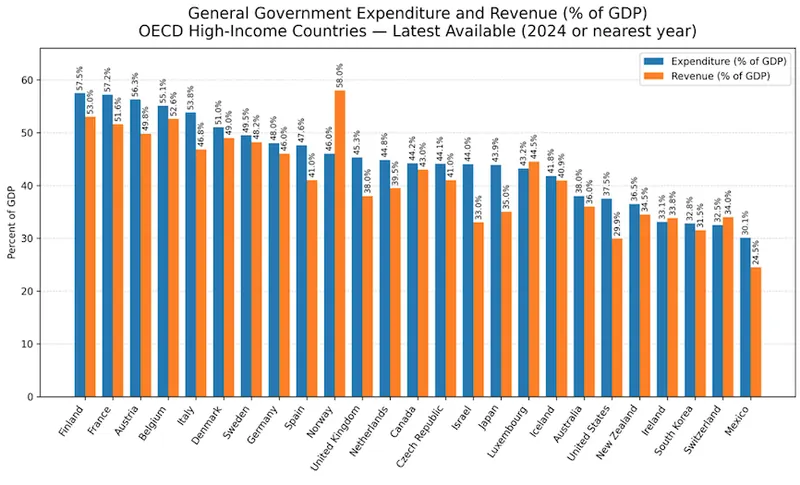
The upshot of Figures 9 and 10 below is this: The United States spends less than almost all of its peer OECD nations, relative to the size of its economy. Yet it also raises substantially less revenue as a share of GDP than do almost all higher income OECD nations. Only Mexico, in this array of nations, raises less revenue relative to GDP. Hence, we have significantly higher deficits, despite having “less government.”
As Figure 10 below reports, the U.S. emphasizes defense spending and interest on debt dramatically more than do other OECD nations and much less so on pensions, social insurance and transfers, or infrastructure.
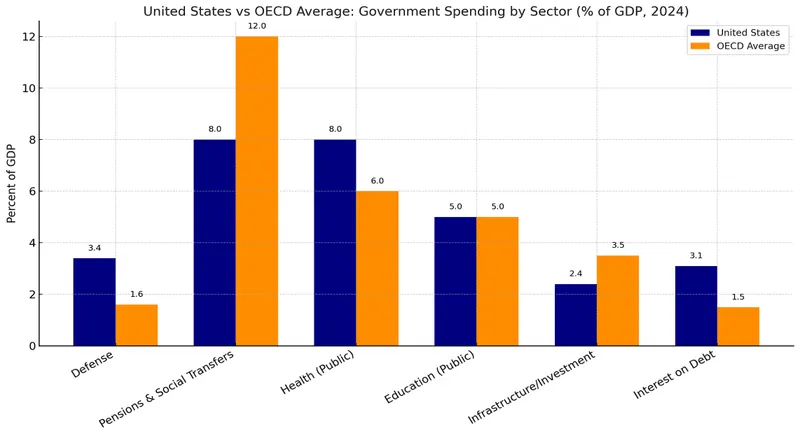
Nothing presented here or advocated here necessarily implies that we should spend more on this or that or raise more revenue. It is hard to claim, however, that the U.S. has a fiscal problem because it spends too much compared to other nations.
Much of our recent national debt is due to the massive government spending that was initiated during two, potentially catastrophic crises in the first two decades of the 21st century. Our Great Recession and Pandemic outlays were essential, and likely did important things to make our economy “the envy of the world,” as declared by the conservative Economist magazine in its October 19, 2024 issue – high praise despite our rocketing national debt in 2024.
Although the public health response to the Pandemic might be faulted, our economic performance coming out of, first the Great Recession and then the Pandemic were critical in preventing far more severe economic collapse and greater public suffering.
The narrative here highlights at least three important facts about our national debt. First, generating annual budget deficits and rapidly adding to our national debt during crises are often required to prevent severe, short-term, present-day suffering or even economic collapse. So it was with the challenges of the Great Recession and the Pandemic.
Second, particularly in the United States of today, managing the other side of the prescription, cutting outlays and raising taxes, when reducing debt and deficits would be beneficial, is something we find extraordinarily difficult.
Third, it seems that pinpointing when a national debt burden actually turns into an existential fiscal crisis is not as predictable as is the certainty of the dark symphony of dire warnings that each tide of new debt inspires.
Tax Expenditures: Stealth Generators of Debt
During recent decades, the use of tax expenditures – provisions like deductions, exemptions, and credits – along with big tax cuts, have eroded the tax base and effectively act as government spending by another name. Moreover, these disguised expenditures significantly add to the national debt and need to be included in any description of the national debt terrain.
For example, the federal tax exclusion for employer-provided health insurance (which lets workers receive health benefits tax-free) cost the government roughly $35 billion (in 2024 dollars) in lost revenue in 1980, but by 2024 this annual cost had ballooned to about $218 billion. Another major tax expenditure, the lower tax rates on long-term capital gains and dividends, cost an estimated $237 billion in 2024 (versus about $37 billion in 1980).
These are huge sums – each on the order of nearly 1% of GDP – effectively spent through the tax code. The largest single tax expenditure is the deferral/exclusion of earnings on retirement savings (pensions and 401(k) plans), which was roughly a $380 billion revenue cost in 2024. Over time, new tax breaks have been added as well, such as the Child Tax Credit, which did not exist in 1980 but by 2024 was reducing tax revenues by about $127 billion per year.
While these tax expenditures often serve important and laudable social or economic goals (encouraging home ownership, retirement saving, etc.), they also significantly reduce federal revenue every year. The proliferation and expansion of tax expenditures since the 1980s have made it harder for government revenues to keep up with spending. The result, of course, contributes to our persistent annual deficits, which subsequently add to our national debt. Tax expenditures contribute, along with other features of the tax code, to a persistent decline in “tax buoyancy” or “elasticity,” the extent to which tax revenues increase along with economic growth.
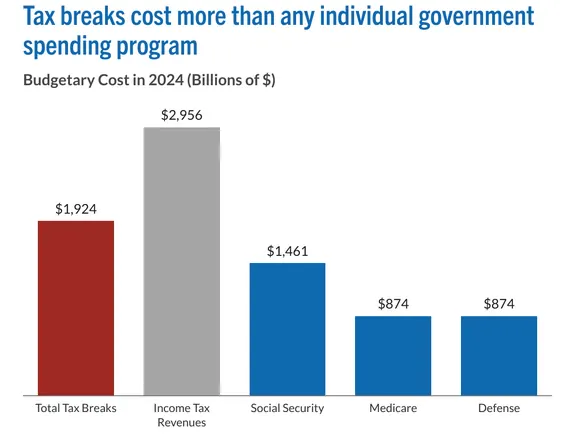
Any comprehensive assessment of the national debt as a problem must include these “hidden” spending items. They are silent drivers of the debt growth, which often escape the immediate notice of the public because they operate as forgone taxes rather than visible outlays. Adding to their camouflage, tax expenditures are not exposed to annual review through the rigors of the yearly budget process. For the year 2024, as depicted in the previous figure, tax expenditures account for nearly 7% of GDP. The following figure depicts the current magnitude of tax expenditures. In the words of the Peter G Peterson Foundation:
In 2024 tax expenditures totaled nearly $1.9 trillion. That amount equals about 65 percent of the revenues that the federal government actually collected in income taxes and exceeds what was spent by any single agency or spending program, including Social Security and the Department of Defense (Peter G. Peterson Foundation, 2025)
Moreover, tax expenditures are more valuable to higher income households and so the likely net effect of these publicly provided tax benefits is to undermine the progressivity of the income tax code, such as it is.
A Word on Interest Costs and Debt Service: The Budget’s Bully
The interest on the national debt is the one line item that can grow without a roll-call vote. If the interest rate grows and interest payment becomes sufficiently large it can crowd out other priorities and transform the national debt into a fiscal and political crisis.
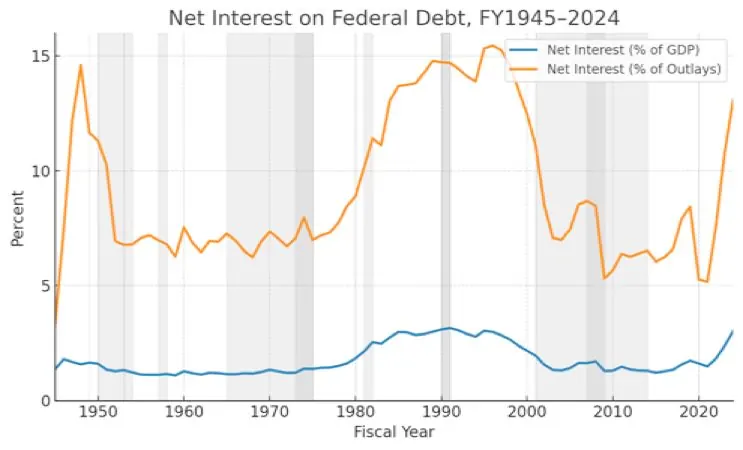
The preceding chart depicts the broad pattern of interest owed on the national debt, with budgeted payments as a percent of GDP and as a percent of government outlays in the federal budget.
The oil and energy crisis of the early 1970s did set off a particularly challenging combination of relatively high inflation and slow economic growth. After 1980 we began to see the rising burden of interest on the national debt, accelerating both as a percent of GDP and the federal budget. Interest on the national debt climbed to nearly 15 percent of the federal budget by 1991. In fact, reaching above 15% of federal outlays a few years later.
We experienced quick increases in debt budget burdens after the Bush II tax cuts, and then the effects of the Great Recession and Pandemic as interest on our national debt as a percent of the budget approaches previous records. If prevailing market interest rates remain high and continue growing, the crowding out issue will intensify and the size of interest payments could itself generate more national debt.
Regardless of ideology, given the size of our national debt, we are vulnerable to big increases in nominal interest payments as prevailing interest rates rise, even by a small amount. When you owe $37 trillion, even a small interest rate increase can create budget havoc.
Possible Lessons from Other Nations and their National Debt.
Sweden today has a debt-to-GDP ratio of around 30% (See the following Figure 13), which it achieved after accepting a series of difficult policy choices. After a 1990s fiscal and banking crisis and a very serious, subsequent economic downturn, Sweden replaced its earnings-related, defined-benefit retirement system with a system that has an automatic balancing mechanism that trims growth in welfare and retirement benefits when liabilities outpace contributions. This has grafted sustainability into the national Swedish budget and substantially insulated pensions from demographic and economic shocks.
Sweden now sets two long-run anchors for the entire public sector. First, a budget surplus target: on average over the business cycle, public finances should run a small surplus of about one-third of a percent of GDP. Second, a debt anchor: the consolidated public debt (the EU “Maastricht” measure) should be around 35% of GDP, with a tolerance band of ±5 points. If debt moves outside that band, the government is required by law explain why it happened and how it will steer back towards the anchor level.
Sweden is a notable example, although it is similar to the fiscal history of a number of other OECD nations, because it supports a strong social welfare state. Yet, Sweden was able to make dramatic reforms as it addressed a very serious economic crisis in the 1990s.[5] It initiated modest, but significant, reductions in the size of the Swedish state and created a sustainable, long-term system of discipline for its largest entitlement programs and its overall government spending and taxing. The Swedish example refutes the claim that there is some inexorable, irreversible growth in the size of government, with fiscal and economic collapse the inevitable outcome.
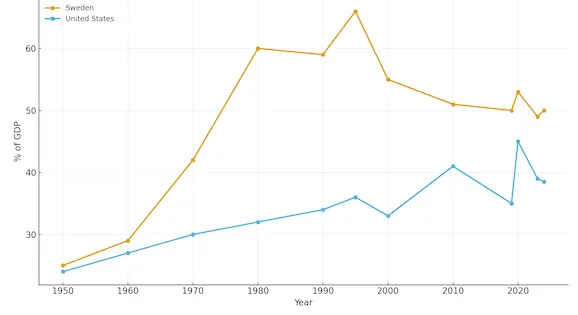
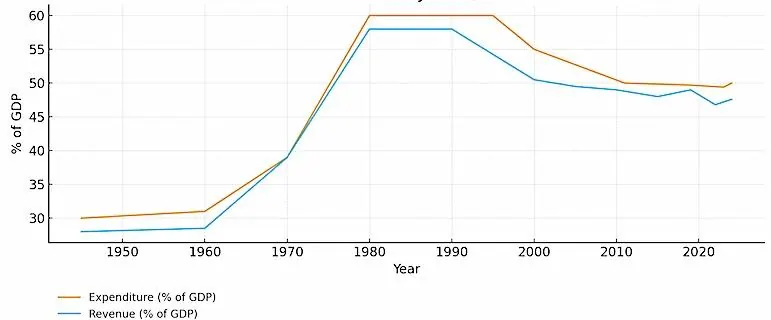
It is common to measure “the size of government” by measuring total government expenditures as a percent of GDP. By that standard, in 1993, Sweden peaked at between 67-70% of GDP. That peak, which you can see in the preceding Figure 14, resulted after a rapid spike in crisis-related spending for bank-bailouts, counter-cyclical welfare spending and a shrinking GDP in the denominator.
The overall government fiscal reforms and pension changes in Sweden have brought government expenditures to around 48-50% of Sweden’s GDP.
After peaking at about 46-47% of GDP in 2020, as of the end of 2024 total U.S. spending settled at about 36-38% of GDP (See preceding Figure 14), mostly due to our nation’s rapid GDP increase between 2021-2024, not because of any fiscal reforms; the decline happened despite the absence of any major fiscal policy reforms.
Conclusions
By the end of 2025 the gross federal debt of the United States will be around 124% of GDP, with publicly held debt at about 100%. Tariff revenue is a bit of a wildcard, both with respect to how much tariff revenue will be raised, and how much of an impact tariffs will have on GDP growth.
Assessing the range of tariff dynamics, including retaliation from other nations, slower long-term growth, reduced consumption by households, and so on, causes almost all analysts to view tariffs, in today’s world, as among the least effective ways to raise revenue (Fitch Wire, 2025; York and Durante, 2025; Bellocchi and Travaglini, 2025). Other tax measures would be more effective as deficit reduction measures. If tariffs slow growth, they also threaten to actually worsen the debt-to-GDP ratio going forward.
I am in no position to judge authoritatively how likely our nation is to collapse in financial ruin or what other kinds of pain we might endure, as a result of our national debt burden. Or whether we just continue growing national debt and thrive, nevertheless. On the other hand, there is an emerging consensus among a broad base of scholars, policy-makers, and experienced actors in financial markets and others with expertise in the subject, that it is not prudent, to say the least, for our national debt to grow indefinitely, at a rate that exceeds the growth in our GDP.
Nevertheless, let’s dump the notion that rapidly getting rid of our national debt should be important. Absent any immediate threat of collapse, just bending the curve on national debt growth for an extended period should be the paramount focus. Establishing a credible, long-term program of reducing the growth of annual budget deficits and national debt alone will have a quick, moderating influence on interest rates, which, in turn, will also ease pressure on annual budgets by reducing interest paid on the national debt.
It is important, as well, to establish and sustain an independent arbiter (e.g., create a National Council for Fiscal Balance) that reviews and evaluates the quality of forecasts and assesses compliance with fiscal discipline goals. The entity must have considerable autonomy, be armed with exceptional expertise, have a broad political and societal base, and have its statements and reports taken seriously. In an age where a prevailing pastime and tactic in politics is to undermine the credibility and legitimacy of expertise, it will be hard to establish or nurture such a body. But having the highly visible assessments of widely recognized expertise and credibility concerning our nation’s public finances is one of the most important minimums to be accomplished.
Adjustments to the tax code must significantly increase the buoyancy of the nation’s tax base and improve its fairness. Economic growth should yield more revenue than is currently the case. A winning coalition committed to fiscal discipline will also likely require some assurances that revenue increases will not be exclusively allocated to expand existing or to create new public programs, at least until certain national deficit and debt reduction targets are met. Spending and taxing reforms and adjustments must always be on the table and managed in good faith.
Health care costs that are compensated by public funds need to be regulated more closely, particularly since so much of public spending on health care is driven by largely uncontrolled costs. The result is that the health care sector in the U.S. is a higher percentage of the economy than among any other advanced economy. And we do this despite experiencing far poorer outcomes. Paying more for less in such a hefty segment of our economy is just one important factor diminishing our economic performance, unless one presumes that it is an accomplishment for a nation to “excel” and develop a “competitive advantage” in producing a lot of sick people and paying a whole lot of money to care for them. Many people might consider that to be perverse.
Other nations, e.g., Germany, Switzerland, and the Netherlands, also rely on private insurers and private health providers, but there is substantially more public price and product control than in the United States. Remember that the U.S. also has kept in place the open-ended, no-limit tax expenditure for employer provided health insurance. It’s a massive system of publicly subsidized, private health care insurance with relatively little consequential oversight or public regulation focused on reducing costs.
Finally, the United States spends far more on national defense than any other nation, including those nations that we consider to be our most dangerous military threats. American military outlays are equal to nearly 40% of the entire world’s military spending. As of 2024, the U.S. spends more on its military than the next 10 countries combined (China, Russia, India, Saudi Arabia, United Kingdom, Germany, France, South Korea, Japan, and Ukraine).
I am not a security studies or international relations expert. The process of reducing our defense burden will require drastic reshaping of our strategic doctrine; assessing and forging alliances with other nations; and investigating, in that context, how sharing defense costs might also produce important savings to reduce our annual budget deficit. Substantial efficiencies and savings in national defense costs are possible. They should be pursued aggressively.
As a technical matter, our national debt and annual budget deficit challenges are straightforward. The United States is, even in the current circumstances, a fantastically wealthy nation. Its capacity to become much more affluent, if steered effectively, is enormous. Fundamentally, therefore, our national debt’s size is in itself not the key issue. Getting sensible control over the national debt does not require dramatic, much less instant, fiscal solutions. What is required is a plausible, sustained, and broad-based effort to bend downwards the curve of our national debt.
There are many workable options that would have salutary effects on our fiscal challenges. We know what it will take to produce a fair and effective set of policies. So the immediate obstacle to making progress isn’t figuring out what budgeting, taxing, and spending practices need to be adopted. So what is the most difficult impediment in making progress on the national debt challenge? It is this. It is crafting a stable, politically viable governing coalition committed to an effective, actionable vision of how to manage annual deficits and our national debt. In today’s political milieu it seems naive to even dream of such things. As dire as things stand now, if we cannot bring about the vision, never mind dream of it, so much the worse for us and those who will have to struggle in the future.
References
Austin, Andrew D. (2015). “The Debt Limit: History and Recent Increases.” Congressional Research Service, November 2. https://sgp.fas.org/crs/misc/RL31967.pdf
Balkir, Akcan S., Emmanuel Saez, Danny Yagan, Gabriel Zucman (2025). “How Much Tax Do Billionaires Pay? Evidence from Administrative Data.” Working Paper 34170, National Bureau of Economic Research. http://www.nber.org/papers/w34170
Barnes, Lucy and Timothy Hicks (2018), “Making Austerity Popular: The Media and Mass Attitudes toward Fiscal Policy.” American Journal of Political Science, 62 (April): 340-354.
Bartels, Larry M. (2005). “Homer Gets a Tax Cut: Inequality and Public Policy in the American Mind.” Perspectives on Politics, 3 (March): 15-35.
Bartlett, Bruce (2007). “Starve the Beast: Origins and Development of a Budgetary Metaphor.” Independent Review 12 (Summer): 5-26.
Bellocchi, Allesandro and Giuseppe Travaglini (2025). “The Trade Deficit Delusion: Why Tariffs Will Not Make America Great Again.” Intereconomics, 60 (Issue 4): 227-234. https://www.intereconomics.eu/pdf-download/year/2025/number/4/article/the-trade-deficit-delusion-why-tariffs-will-not-make-america-great-again.html .
Brady, Demian (2022). Government Spending in Historical Context. Washington, D.C.: National Taxpayers Union Foundation (April 7).
Chirelstein, Marvin A. (1986). “Back from the Dead: How Ronald Reagan Saved the Income Tax.” Florida State University Law Review, 14 (Summer): 207-227.
Committee for a Responsible Federal Budget (2017). “Tax Cuts Don’t Pay for Themselves.” Washington, D.C.: Committee for a Responsible Federal Budget (October). https://www.crfb.org/papers/tax-cuts-dont-pay-themselves
Conti-Brown, Peter (2015). “The Institutions of Federal Reserve Independence.” 32 Yale J. on Regulation, (no. 2, 2015): 256-310. http://digitalcommons.law.yale.edu/yjreg/vol32/iss2/3?utm_source=digitalcommons.law.yale.edu%2Fyjreg%2Fvol32%2Fiss2%2F3&utm_medium=PDF&utm_campaign=PDFCoverPages
Congressional Research Service (2025). “Impoundment Control Act of 1974 : Background and Congressional Consideration of Rescissions.” Washington, D.C.: Congressional Research Service (February 25). https://www.congress.gov/crs_external_products/R/PDF/R48432/R48432.2.pdf
Crafts, Nicholas and Peter Fearon (2010). “Lessons from the 1930s Great Depression.” Oxford Review of Economic Policy. 26 (Autumn): 285-317.
Eberly, Janice C, Stock, James H, and Wright, Jonathan H. (2019). “The Federal Reserve’s Current Framework for Monetary Policy: A Review and Assessment.” National Bureau of Economic Research Working Paper, June. http://www.nber.org/papers/w26002
Financial Crisis Inquiry Commission (2011). The Financial Crisis Inquiry Report. Washington, D.C.: U.S. Government Printing Office, February 25. https://www.govinfo.gov/content/pkg/GPO-FCIC/pdf/GPO-FCIC.pdf
Fitch Wire (2025). “US Tariffs Have Mixed Fiscal Impact, Will Not Solve Underlying Challenges.” https://www.fitchratings.com/research/sovereigns/us-tariffs-have-mixed-fiscal-impact-will-not-solve-underlying-challenges-08-04-2025.
Gale, William G. (2019). “Five Myths About Federal Debt.” Washington, D.C. : Brookings Institution (May, 2).
Graetz, Michael J. (2024). The Power to Destroy: How the Anti-Tax Movement Hijacked America. Princeton, New Jersey: Princeton University Press.
Hansen, John Mark (1998). “Individuals, Institutions, and Public Preferences over Public Finance.” The American Political Science Review, 3 (September): 513-531.
Ippolito, Dennis (2012). Deficits, Debt, and the New Politics of Tax Policy. New York: Cambridge University Press.
Khan, B. Zorina (2016). “The Impact of War on Resource Allocation: ‘Creative Destruction,’ Patenting and the American Civil War.” Journal of Interdisciplinary History, 46 (Winter): 314-353.
Lawson, Alan (2006). A Commonwealth of Hope: The New Deal Response to Crisis. Baltimore, Maryland: Johns Hopkins University Press.
Lee, Yunsoo (2018). “The Great Recession, Government Performance, and Citizen Trust.” Journal of International and Area Studies. 25 (June): 57-70
Martin, Isaac William (2008). The Permanent Tax Revolt: How the Property Tax Transformed American Politics. Stanford, Calif.: Stanford University Press.
McGrath, Michael (2017). “When the Public Loses Faith in American Institutions.” National Civic Review. 106 (Summer): 46-51.
Mitchell, Terence R. and William G. Scott (1987). “Leadership Failures, the Distrusting Public, and Prospects of the Administrative State.” Public Administration Review. 47 (November-December): 445-452.
Modigliani, Andre and Franco Modigliani (1987). “The Growth of the Federal Deficit and the Role of Public Attitudes.” The Public Opinion Quarterly, 51 (Winter): 459-480.
National Commission on Fiscal Responsibility and Reform (2010). The Moment of Truth: Report of the National Commission on Fiscal Responsibility and Reform. https://www.ssa.gov/history/reports/ObamaFiscal/TheMomentofTruth12_1_2010.pdf
Peterson, Peter G., Foundation. 2025. “Understanding the Federal Budget.” New York, New York: Peter G. Peterson Foundation, 2025, https://www.pgpf.org/federal-budget-guide/
Ransom, Roger L. (1998). “The Economic Consequences of the American Civil War.” In The Political Economy of War and Peace, edited by M. Wolfson. Norwell, MA: Kluwer Academic Publishers: 49-74
Research Department, Federal Reserve Bank of San Francisco, “Indexation and Bracket Creep,” SF FRB Weekly Newsletter, April 30, 1982 (https://www.frbsf.org/economic-research/wp-content/uploads/sites/4/el82-18.pdf)
Schudson, Michael (2004). “Notes on Scandal and the Watergate Legacy.” American Behavioral Scientist. 47 (May): 1231-1238.
Steele, James B (2022). “How Four Decades of Tax Cuts Fueled Inequality.” The Center for Public Integrity, November 29, 2022 (https://publicintegrity.org/inequality-poverty-opportunity/taxes/unequal-burden/how-four-decades-of-tax-cuts-fueled-inequality/ )
Temin, Peter (1969). The Jacksonian Economy. New York: W. W. Norton & Company.
Thorndike, Joseph J. (2010). “The Fiscal Revolution and Taxation: The Rise of Compensatory Taxation, 1928-1938,” Law and Contemporary Problems, 73 (Winter): 95-122.
Wolla, Scott A. and Kaitlyn Frerking (2019). “Making Sense of the National Debt.” St. Louis, Missouri: Federal Reserve (November,1).
York, Erica and Alex Durante (2025). “Trump Tariffs: Tracking the Economic Impact of the Trump Trade War.” Washington: D.C. Tax Foundation.
I relied on a number of standard data sources for this presentation. These include Office of Management and Budget (OMB), Historical Tables; Congressional Budget Office, Budget and Economic Data; U. S. Treasury Department, Historic Debt Outstanding and Financial Report of the U.S. Government; Government Accountability Office; Joint Committee on Taxation; Federal Reserve System, FRED (via St. Louis Fed). I also relied on reports and charts provided by such entities as Brookings Institution, Urban Institute, Peterson Foundation, Committee for a Responsible Federal Budget, and the National Taxpayers Union. ↩︎
Our system of place-based, candidate-oriented elections undermines, for good or ill, perspectives that focus on national, rather than local, interests. It’s a whole other matter, but House and Senate members are obviously oriented towards their state or regional or local constituents, and when those clash with some national need, the latter often suffers (Ippolito, 2012). ↩︎
Of course, the Federal Reserve is not infallible and can make mistakes or fail in important ways too (Conti-Brown, 2015; Eberly, Stock, and Wright, 2019) ↩︎
Bracket creep is the process whereby people are pushed into higher tax brackets when nominal wages rise due to inflation, even if the real value or purchasing power remains the same or decreases. ↩︎
Sweden’s imminent entry to the European Union at the time figured prominently in its adoption of the structural and institutional changes described here. The key thing is that serious, enforced, and legitimate norms and rules regarding how the size of budgets and the national debt relative to GDP were adopted and enforced. ↩︎
© 2025 Max Neiman, Ph.D. All rights reserved.